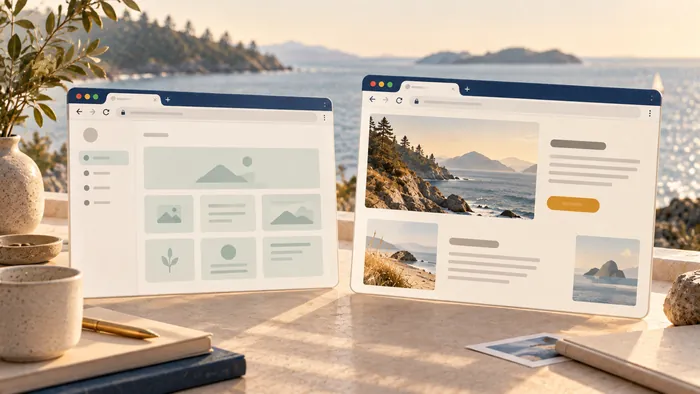
A data dashboard for a small business is one screen that shows the few numbers you use to run the company. It pulls from your accounting, sales and marketing tools, so you stop hunting through five logins. A business intelligence dashboard displays KPIs and other business metrics on one screen, usually with charts that show trends. The hard part is not the charts. It is choosing what belongs on the screen. This guide walks through that choice, then the build.
TL;DR
- A business analytics dashboard puts four to six key numbers in one place, tied to decisions you actually make.
- Start with the decisions, then pick the data. Do not start with whatever your tools happen to export.
- A spreadsheet is a fine first dashboard. Move to a custom build when manual updates become the bottleneck.
- Put the most important numbers first, show comparisons, and flag anything that is off.
- Review most numbers monthly, and the critical ones weekly when you are growing.
What a dashboard does for a small business
Most owners already have the data. Sales sit in one tool. Invoices sit in another. Ad spend lives in a third. A dashboard brings them into a single view so you can answer simple questions fast.
Is money coming in at a healthy pace? Are invoices getting paid? Is customer work stuck somewhere? Are we growing, or just busy?
A good dashboard replaces the Monday morning scramble. You open one page and know where you stand.
A bad dashboard is decoration. If a number on the screen never changes a decision, remove it.
Start with decisions, not data
The most common mistake is opening your tools, seeing what they can export, and charting all of it. You end up with twenty tiles and no answers.
Do it the other way around. Write down the five to ten decisions you make most often. For example:
- Can we hire this quarter?
- Which marketing channel gets more budget?
- Which jobs are running late?
- Do we need to chase unpaid invoices?
Then ask what number would make each decision easier. That list is your dashboard. Anything that does not map to a decision stays off.
Which metrics to include
Keep the list short. Xero's guide for small businesses suggests tracking four to six KPIs that match your goals, covering efficiency, growth, health and resilience. Its examples include revenue growth, gross profit margin, customer acquisition cost, churn rate and cash runway. It also says each KPI should be clearly defined and based on data you can collect reliably.
Here is how that looks by function.
| Function | Numbers worth tracking | Question it answers |
|---|---|---|
| Finance | Revenue, gross profit, cash balance, accounts receivable, accounts payable, budget variance | Are we profitable, and do we have cash? |
| Sales | Pipeline value, conversion rate, average deal size | Will we hit next quarter's target? |
| Marketing | Leads and cost per lead by channel, website conversion rate | Where should the next dollar go? |
| Operations | Jobs open, jobs late, turnaround time, inventory on hand | Where is work getting stuck? |
| Support | Open tickets, first-response time | Are customers waiting too long? |
The finance row follows the usual financial dashboard metrics: revenue, gross profit, cash balance, receivables, payables and budget variance.
Financial health numbers
Cash is the number that ends businesses, so it gets top billing. Show your current balance, what customers owe you, what you owe others, and how many months you can run at the current burn.
These are also the numbers a bank looks at. If you ever apply for financing, it helps to know how lenders evaluate business health. A dashboard that tracks the same figures keeps you ready for that conversation.
Sales and marketing numbers
Track where leads come from and what each one costs. Then follow them to closed work. If one channel brings in many leads that never buy, the dashboard should show it plainly.
Tying spend to results is what makes marketing analytics and ROI useful rather than a pile of reports. If you run a local service business, your Google Business Profile is often the first source of leads, so we wrote a short guide on keeping your Google Business Profile in shape in about 30 minutes a week.
How to bring your data together
You do not need a data team. You need a clear order of work.
- List your sources. Typically that is accounting software, a CRM, a payment processor, your website analytics and a few spreadsheets.
- Pick one owner per number. One person is responsible for each figure being right.
- Define each metric in one sentence. "Revenue" should mean the same thing every month.
- Collect it the same way every time. Consistency matters most, whether you use a notebook, a spreadsheet or a system you already own.
- Build the view. Start simple, then improve it.
Start in a spreadsheet
A spreadsheet is a legitimate first dashboard. One accounting guide suggests exporting reports from your accounting software and splitting the workbook into four areas: Data, Calculations, Dashboard and Checks. The Checks area matters. It catches the quiet errors, like a total that no longer matches your books.
If you run a trades business on QuickBooks Online, our note on QuickBooks Online integrations for trades shows what can be connected so the numbers update on their own.
When a spreadsheet stops being enough
You will know. Someone spends half a day each week copying numbers. The file breaks when two people edit it. Customers or dealers need to see their own data. Or your tools do not talk to each other at all.
At that point, a custom dashboard that reads from your systems directly saves real time. Our post on choosing between a custom app and a no-code builder covers how to decide.
How to display the data so people act on it
A dashboard is read in seconds. Design for that.
UCI's data visualization guidance boils down to a few habits:
- Show the most decision-relevant KPIs first and make them prominent.
- Add comparisons and trends, so a number has context.
- Make exceptions visible, so a late job or a cash dip stands out.
- Use readable charts with consistent scales and labels.
- Offer a path from summary to detail through filters, instead of cramming every data stream onto one screen.
Match the chart to the question. A single big number works for "where are we right now." A line chart works for "how is this changing over time." A bar chart works for "which channel, product or customer group is ahead."
And resist the urge to add more. Ten clear tiles beat forty crowded ones.
How often to review it
The same Xero guide recommends reviewing most KPIs monthly, checking critical metrics weekly during growth phases, and doing a deeper quarterly review with your accountant. It also recommends automating data collection where you can.
A simple rhythm works well:
- Weekly, 15 minutes: cash, open invoices, pipeline, jobs at risk.
- Monthly, 45 minutes: profit, margins, channel results, trends.
- Quarterly: step back. Are these still the right numbers? Drop the ones nobody used.
A dashboard should change as your business does.
Our point of view
We build custom websites, apps and automation for business owners in Canada and the US. Dashboards come up in almost every project, and the pattern is the same.
Owners rarely lack data. They lack time. The numbers live in five places, and someone pastes them together by hand. That is where we start: the workflow, not the chart.
We think a dashboard earns its place when it removes a weekly chore and changes a decision. So we ask what you decide, what you check, and what you copy by hand. Then we connect those sources and show only what you need.
We work closely with clients from idea to launch, and we keep the process open so you always see what is being built and why. If a spreadsheet does the job today, we will say so. When it stops doing the job, a custom dashboard, connected to your tools and automated where it makes sense, is usually the next step.
Loic
Build your dashboard with us
If you want a dashboard that reads from your accounting, CRM and website without anyone copying numbers, we can scope it with you. It can be a custom web app built around your decisions, with the right people seeing the right data.
We design and build websites, apps and automation, and we are based in Kelowna and Vancouver, BC. See what we do on our services page, or tell us what you track today at westcode.io. For ideas on what to automate first, read AI automation for small business.
FAQ
What is the difference between a data dashboard and a report?
A report is a snapshot, usually longer, that you read once. A dashboard is a live or regularly refreshed view of a few key numbers that you check often. Reports explain. Dashboards tell you where to look.
How many metrics should a small business dashboard have?
Fewer than you think. Aim for four to six core KPIs on the main screen, based on Xero's small business guidance. Keep detail one click away, in a filter or a second page.
Can I build a dashboard in a spreadsheet?
Yes. Many businesses begin there, using exports from their accounting software and a separate Checks tab to catch errors. Move to a connected, automated dashboard when manual updating eats your time or more people need access.
How much does a custom dashboard cost?
It depends on how many systems it connects to and who needs access. We scope and quote each project to its needs, so we do not publish a fixed price. Tell us your sources and your decisions, and we will give you a clear estimate.
Sources
- What is a Business Intelligence Dashboard (BI Dashboard)? TechTarget
- KPIs for business: a complete guide for small business, Xero
- How to Build a Financial Dashboard for Your Small Business, Fit Small Business
- Data Analytics Beginner's Guide, My Own Business Institute, Santa Clara University
- Data Visualization Best Practices, UCI Data Central
- Why analytics in marketing drives better ROI
- How Lenders Evaluate Business Health